Stocks are one of the simplest and most passive types of income, but when we invest in the stock market, we always feel that the current stock price is on the high side, but if we don’t enter the market to buy stocks, we are afraid that the stock price will continue to rise. When the U.S. stock market continues to hit new highs, should it enter the market or should it wait and see and wait for the crash to enter the market.
First of all, I want to declare that I am a value investor and insist on the BUY AND HOLD operation method. We all know that stocks are cyclical, and we are now experiencing the longest bull market in history. Stock market analysts believe that a crash may come at any time, but we just have no way to predict the specific time. I believe everyone understands. But I know that a bear market will definitely come. The long-term trend of stocks often has several economic data as a reference. Today we will take a look at these economic data.
source:tradingview
capital flows and net ETF issuance
1. The first indicator is the consumer confidence index. This data has a pivotal position in the analysis of megatrends because most of the US GDP is composed of the consumption of our consumers. You can see this graph Is this true? The current latest consumer confidence index, we can see the data from 2010 to today, how much impact this data has on the U.S. stock market? Let's take an example. Let's take a look at the 2008 financial crisis. In the past, the consumer confidence index was compared with the U.S. stock market at that time. The consumer confidence index showed a very large decline before the stock market fell. Then let’s take a look at today’s chart.
 |
| U.S. Michigan Consumer Sentiment |
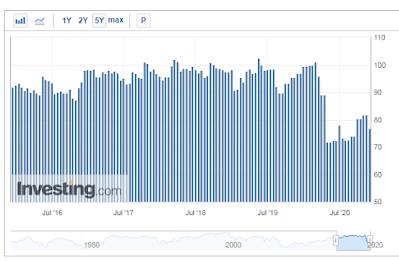
2. The second indicator is the Purchasing Manager Index. This economic data plays a very important role in the change in economic trends. It is not difficult to see that this data after 2009 has remained above 50 most of the time. The reflection on stocks is also that most of them are on the rise, that is, investors believe that as long as the index is above 50, it is acceptable, but if this indicator falls below 50, then an economic crisis may occur, so we act Investors, we should focus on whether this index has fallen below 50, that is, in the coming months, if this index falls below 50, then we may consider whether a crash is coming.
 |
| U.S. ISM Manufacturing Purchasing Managers Index (PMI) |
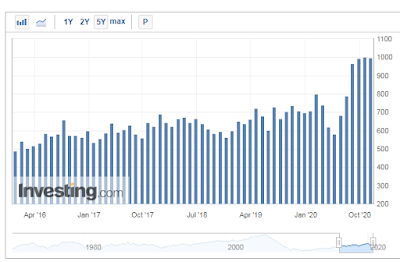
3. The third economic indicator is the annualized total number of new home sales, which has always been closely linked to the U.S. economy. The last financial crisis in 2008 was directly caused by the subprime mortgage crisis in real estate, which shows its high relevance to the economy. So let’s take a look at the recent data. The sales of new homes in the United States have been steadily increasing. Although there are some small twists and turns, it is not difficult to see that the general direction has been rising. It shows that the real estate market is on a hot stage.
 |
| U.S. New Home Sales |
Let us look at another piece of data, that is, the index of house prices. This is the change in the index of house prices every month. It was particularly sensitive before the onset of the Great Depression. We can look at the comparison. When the financial crisis came in 2008, we can see that at that time The rate of decline in housing prices,
 |
| U.S. S&P/CS HPI Composite - 20 n.s.a. YoY |
4. The fourth one is also one of the most important data that I think is the interest rate curve. This interest rate curve shows that the super short-term, short-term, medium-term, and long-term interest rate relationships are theoretically in a healthy economic cycle and long-term The interest rate must be higher than the short-term interest rate. First, let's take a look at the interest rate curve in 2017. From short-term interest rate to long-term interest rate, interest rate from low to high, it can be seen that the economy is very healthy. Then look at the interest rate curve in 2018, forward Interest rates have begun to fall. Then let's take a look at the recent 2019. Interest rates have inverted. This shows that short-term interest rates are already higher than medium-term or even 10-year interest rates.
 |
| 10-Year Treasury Constant Maturity Minus 2-Year Treasury Constant Maturity |
From this, we can judge that the economic environment is unstable. Sex, let’s take a look at this graph again. This graph shows the interest rates of 10-year and 2-year Treasury bonds. When they get closer to each other, there will be a bear market afterward. Everyone looks at the gray vertical bar in the middle, which means that the United States gives a bear market. But it can also be seen from this chart. Although we know that there will be a bear market in the future, it can be seen from these examples that each plunge does not occur as soon as it drops to 0, so we are in the short-term There is no need to panic, but we should know very clearly that next, a bear market may appear at any time.
Should we enter the market now or wait for the crash before entering the market? First of all, I personally think that a mature capital market, it is like the US stock market. Anytime you are doing a long-term investment, it is good. Opportunity, after analyzing the above data, although the interest rate curve is in a bear market, the PMI index and the new home sales index are both good, but the consumer confidence index is falling, coupled with the Fed's low-interest-rate policy,
according to past history I have gained experience from the data, including the U.S. stock market. I personally think that I will continue to invest in the stock market. All the above remarks do not make any investment advice. Investment is risky.


Comments
Post a Comment