
10 stocks tell you why U.S. stocks plunged!


On February 24, 2020, the U.S. stock market plummeted by 1,000 points. Since the outbreak of the new coronavirus epidemic, although market funds have already begun to flow into safe-haven assets such as gold and bond markets, the epidemic does not seem to have an impact on the stock market trend. 

As the new coronavirus epidemic spread further, and companies began to publish performance reports, investors began to worry that the epidemic would affect the company's next quarter's profit growth and made predictions for the company's next quarter's performance. 

Analysts lowered the companies The profit forecast for the next quarter, and the Fed is expected to cut interest rates in March, the Fed's rate cut indicates that the economy may further decline.
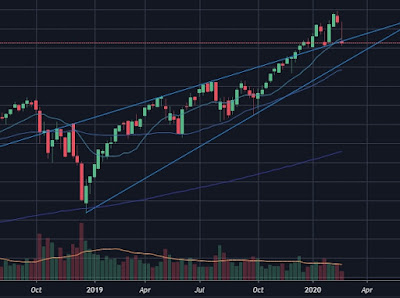
S & P 500 Index
Fed watch


As an investor, you need to know how to value a company using PEG indicators. Generally speaking, the valuation using the PEG indicator is more accurate, but it is only used to analyze the latest quarterly data, because the company's profit growth is always changing, and the long-term valuation of the company may not be applicable. The so-called PEG indicator is the company's price-earnings ratio (PE) divided by the company's annual growth rate of earnings per share (G). 

(PE) simply reflects the current value of a stock, and PEG links the current value of the stock to the earnings growth of the stock. For example, the current price-earnings ratio of a stock is 20 times, and the performance report shows that the annual growth rate of EPS is 20%, then the PEG of this stock is 1. When PEG equals 1, it indicates that the valuation given to this stock by the market can fully reflect the growth of its performance.

PEG = PE / G x100

If the PEG is greater than 1, the value of the stock may be overvalued, or the market believes that the company's performance growth is lower than market expectations. When the PEG is less than 1, the value of the stock may be undervalued, or the market believes that the company's performance growth is higher than the market's expectations. 

Usually, the company's profit is in the growth stage, and the PEG index will be lower than 1. Investors need to note that like other financial indicators, PEG cannot be used alone, and must be combined with other indicators. The most important thing here is the expectations of the company's performance.

Then, by analyzing the company's profit forecast for the next quarter, we analyze the PEG index of the ten weighted stocks of the S & P 500 index.

Microsoft  PEG=0.96


Apple  PEG=1.38


Amazon  PEG=2.421


Google  PEG=2.24


JPMorgan  PEG=0.77


Johnson & Johnson  PEG=4.28


Visa  PEG=2.48


Procter & Gamble PEG=9.52


Mastercard  PEG=2.16


Facebook  PEG=1.63

The analysis of the PEG index of the top ten heavyweights of the S & P 500 shows that the value of most companies' stocks is overvalued, so the decline in company stock prices is reasonable, and the value of the US stock market may also be overvalued, causing the US stock market to fall.

Comments

Popular posts from this blog

Will China's economy recover as the epidemic is under control?

During the Chinese Spring Festival, novel coronavirus broke out in Wuhan, and the Chinese stock market was hit hard. Subsequently, the Chinese government quickly took strict measures to block Wuhan, a city with a population of tens of thousands of people, to prevent the further spread of the epidemic, and to take corresponding epidemic prevention measures in other cities.  When the worst of the epidemic had already occurred, the Chinese stock market quickly rebounded. As the number of infections continues to decline, China's Shanghai Composite Index is expected to rise further. Sars Period Looking back on similar events in the past, the SARS epidemic in 2003, the stock market also made a short-term decline, and then the SARS epidemic was brought under control, the stock market immediately went up for a long time. According to past historical data, the impact of the novel coronavirus epidemic on the stock market may be short-lived. China Fund Capital Flow Howeve...

The stock market entering a bear market?

On March 6, 2020, the US stock market continued its decline today after a few days of rebound. Is this the beginning of a bear market in the stock market? Next, let's analyze one important indicator of entering the bear market, Treasury bonds yield. What is the yield of Treasury bonds? Treasury bonds are a tool issued by the state to raise funds. When the bonds are issued, they promise to repay the principal and interest on a specified date. The ratio of the return of Treasury bonds to the principal invested is the return of Treasury bonds.  The main factors affecting bond yield include coupon rate, maturity, face value, holding time, purchase price, and sale price. Rising bond yields and falling bond prices mean investors are selling bonds, turning to invest activities, or entering the stock market. In a healthy economic environment, the longer the Treasury bonds, the higher the bond yield. Because short-term bonds are more liquid, investors are willing to accept lower ...

How to judge the diffusive horn pattern ?

As an investment trader, you must understand the use of chart technology analysis to determine the position of market transactions. Now let's talk about a common pattern in chart technical analysis, which is the diffuse speaker pattern. Diffusion horn patterns are different from trend patterns and horizontal patterns.  Diffusion horn patterns are more difficult to judge than trend patterns and horizontal patterns, and often cause losses to investment traders. So, how do investment traders judge the spreading horn pattern and make favorable investment transactions? S&P500 Index The price trend of the diffusive horn pattern.  When the price rises over some time, then the price falls, and falls below the recent low, then rises, and rises through the last high. It keeps expanding in two directions. If we connect the high point and the low point with straight lines, respectively, we can show a horn shape, so it is called a diffuse horn shape.  Because of this, some i...

The Federal Reserve implements interest rate hikes or cuts?

Generally speaking, the Federal Reserve implements interest rate hikes or cuts. Interest rate rises are austerity monetary policies, and interest rate cuts are a loose monetary policy. When the rate hike cycle begins, it indicates that the Federal Reserve is optimistic about the future economic outlook, economic data shows a positive outlook, and market sentiment is optimistic. To avoid excessive economic growth, the Federal Reserve has implemented austerity monetary policy and implemented interest rate hikes. When the interest rate cut cycle begins, it means that the Federal Reserve is bad on the future economic outlook, the economic data shows a bad trend, and the market is pessimistic. To stimulate economic growth, the Federal Reserve has implemented a loose monetary policy and implemented interest rate reductions. Correlation between the S & P 500 and Federal Reserve interest rates Historical data from the S & P 500 shows that when the rate hike cycle begins, the sto...

Coinbase stock forecast 2025: it's first quarterly report

  After the trading hours on May 13 (this Thursday), Coinbase Global (COIN) will release its first quarterly report.  Take this opportunity to give us a glimpse of the prospects of the first share of cryptocurrency exchanges.  Actually, on April 6, before Coinbase went public, it had already released a forecast for the first quarter of this year. The core data are as follows:  Revenue in the first quarter was approximately US$1.8 billion, a year-on-year increase of 842%; before the net profit was between US$730 million and US$800 million, the median was US$765 million, a year-on-year increase of nearly 23 times!  Assets on the platform are 223 billion US dollars, accounting for 11.3% of the market share of encrypted assets; 56 million verified users, and 6.1 million monthly transaction users (MTU).  It is worth noting that Coinbase's net profit margin reached a terrifying 42.5% in the first quarter, and the business model of “casino” is really profitable! ...