
Bear market coming, gold(GLD) assets become essential

gold

The economic data of the global economic powers have been deteriorating, entering the bear market stage of the economy, and people have become more cautious when choosing asset investment.

We should choose investment products with a low correlation coefficient with economic performance and investment products suitable for the current economic cycle. Investors should pay more attention to foreign exchange and commodity markets so that they can add value to your assets.

Among many assets, anti-inflation commodities such as gold have become essential assets.

Take gold as an example. For many years, gold has been regarded as an anti-inflation commodity by international capital markets and has been regarded as an important asset hedging tool by investors.

There is also a saying, "The world bought gold during turbulent times." From basic political theory, we know that gold is not currency, and the currency is naturally gold and silver.

Although gold has withdrawn from the market as a currency, its attributes as a currency still exist. The credit currency circulating in the market is based on the commitment of a country, and the currency itself is worthless.

In other words, the state promises to convert currency into commodities of corresponding value. Therefore, when a country experiences a credit crisis, it will trigger a currency crisis and the currency in circulation is likely to be worthless.

But gold is not based on national credit, it has high value itself, so it can survive the crisis.

With the risk aversion further heating up, gold is expected to continue to rise.

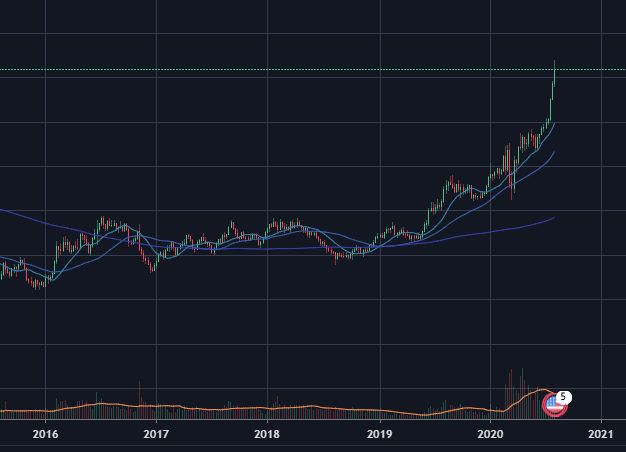
Gold price weekly chart

In terms of technical analysis, the weekly gold price chart is in an upward phase and should continue to be held.

Through the following simple model of gold, The reasonable price of gold is more than $2,500.

Comments

Popular posts from this blog

Will China's economy recover as the epidemic is under control?

During the Chinese Spring Festival, novel coronavirus broke out in Wuhan, and the Chinese stock market was hit hard. Subsequently, the Chinese government quickly took strict measures to block Wuhan, a city with a population of tens of thousands of people, to prevent the further spread of the epidemic, and to take corresponding epidemic prevention measures in other cities.  When the worst of the epidemic had already occurred, the Chinese stock market quickly rebounded. As the number of infections continues to decline, China's Shanghai Composite Index is expected to rise further. Sars Period Looking back on similar events in the past, the SARS epidemic in 2003, the stock market also made a short-term decline, and then the SARS epidemic was brought under control, the stock market immediately went up for a long time. According to past historical data, the impact of the novel coronavirus epidemic on the stock market may be short-lived. China Fund Capital Flow Howeve...

The stock market entering a bear market?

On March 6, 2020, the US stock market continued its decline today after a few days of rebound. Is this the beginning of a bear market in the stock market? Next, let's analyze one important indicator of entering the bear market, Treasury bonds yield. What is the yield of Treasury bonds? Treasury bonds are a tool issued by the state to raise funds. When the bonds are issued, they promise to repay the principal and interest on a specified date. The ratio of the return of Treasury bonds to the principal invested is the return of Treasury bonds.  The main factors affecting bond yield include coupon rate, maturity, face value, holding time, purchase price, and sale price. Rising bond yields and falling bond prices mean investors are selling bonds, turning to invest activities, or entering the stock market. In a healthy economic environment, the longer the Treasury bonds, the higher the bond yield. Because short-term bonds are more liquid, investors are willing to accept lower ...

How to judge the diffusive horn pattern ?

As an investment trader, you must understand the use of chart technology analysis to determine the position of market transactions. Now let's talk about a common pattern in chart technical analysis, which is the diffuse speaker pattern. Diffusion horn patterns are different from trend patterns and horizontal patterns.  Diffusion horn patterns are more difficult to judge than trend patterns and horizontal patterns, and often cause losses to investment traders. So, how do investment traders judge the spreading horn pattern and make favorable investment transactions? S&P500 Index The price trend of the diffusive horn pattern.  When the price rises over some time, then the price falls, and falls below the recent low, then rises, and rises through the last high. It keeps expanding in two directions. If we connect the high point and the low point with straight lines, respectively, we can show a horn shape, so it is called a diffuse horn shape.  Because of this, some i...

The Federal Reserve implements interest rate hikes or cuts?

Generally speaking, the Federal Reserve implements interest rate hikes or cuts. Interest rate rises are austerity monetary policies, and interest rate cuts are a loose monetary policy. When the rate hike cycle begins, it indicates that the Federal Reserve is optimistic about the future economic outlook, economic data shows a positive outlook, and market sentiment is optimistic. To avoid excessive economic growth, the Federal Reserve has implemented austerity monetary policy and implemented interest rate hikes. When the interest rate cut cycle begins, it means that the Federal Reserve is bad on the future economic outlook, the economic data shows a bad trend, and the market is pessimistic. To stimulate economic growth, the Federal Reserve has implemented a loose monetary policy and implemented interest rate reductions. Correlation between the S & P 500 and Federal Reserve interest rates Historical data from the S & P 500 shows that when the rate hike cycle begins, the sto...

Coinbase stock forecast 2025: it's first quarterly report

  After the trading hours on May 13 (this Thursday), Coinbase Global (COIN) will release its first quarterly report.  Take this opportunity to give us a glimpse of the prospects of the first share of cryptocurrency exchanges.  Actually, on April 6, before Coinbase went public, it had already released a forecast for the first quarter of this year. The core data are as follows:  Revenue in the first quarter was approximately US$1.8 billion, a year-on-year increase of 842%; before the net profit was between US$730 million and US$800 million, the median was US$765 million, a year-on-year increase of nearly 23 times!  Assets on the platform are 223 billion US dollars, accounting for 11.3% of the market share of encrypted assets; 56 million verified users, and 6.1 million monthly transaction users (MTU).  It is worth noting that Coinbase's net profit margin reached a terrifying 42.5% in the first quarter, and the business model of “casino” is really profitable! ...